The Crop & Tillage Transect Survey is a county-scale crop and tillage survey conducted by the Department’s staff each spring. The survey provides yearly snapshots and trends over time of data at over 1,000 points including: tillage practices, crop rotations, cover crops, and landuse. The survey has been conducted annually since 1994 with a 2-year gap from 2008 to 2009.
Conservation tillage has been an area of active research for its potential to reduce soil loss through erosion, combat climate change, and improve food security. Conservation tillage is generally described as agricultural operations that leave greater than 30% crop residue cover in the field and includes no-tillage practice. Survey data from 1994 - 2022 has found that there has been a downward trend of conventional tillage (< 15% of residue) in favor of an upward trend in conservation tillage (> 30% of residue). See additional information in the tabs below.
The Crop & Tillage Transect Survey was originally developed by the Conservation Technology Information Center at Purdue in the 1990s to collect conservation tillage and crop residue information using a windshield transect survey. The survey collects data on agricultural fields (if present) at regular half-mile intervals (collection points) along a predetermined road transect path or transect. The transect path was designed to sample agricultural fields representative of the county’s agricultural soils and conditions and avoids urban areas and heavily trafficked roads. This route was recommended to be determined by someone unfamiliar with conservation and cropping efforts in the area of interest to avoid biasing the route.
The survey collection format and attributes collected have varied over the years and some points have dropped out (as they are no longer in agriculture), however the most of the transect points have remained the same - see the transect points in Dane County in the image below - see Figure 1.
Figure 1. Transect Survey points in Dane County, WI (click image to enlarge).
The Transect Survey includes 763 stops and covers about 410 driven miles. Visual estimates (for agricultural fields only) of crop type, tillage system, ephemeral erosion, and crop residue cover were made at approximately 100 feet into the field from the road at each stop on both sides of the road. This results in two field sampling points for most transect stops for a total of 1,161 sample observations.
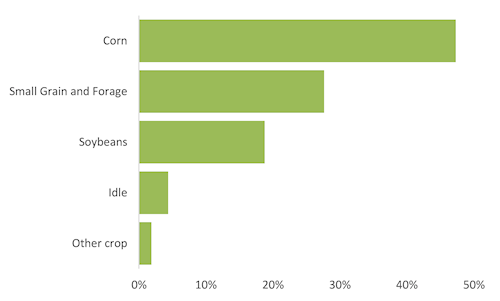
Crops were categorized by the following types: corn, soybean, small grains, forage crops, and other (tobacco, vegetable crops, etc.). Agricultural fields that had no visible or emergent crop were categorized as idle if during a revisit on a later date no crop was observed. The most frequent crop in Dane County is corn (47%), followed by small grains, and forage (28%), soybeans (19%) - see Figure 2.
Figure 2. Crop distribution for transect observations from 1994 - 2022.
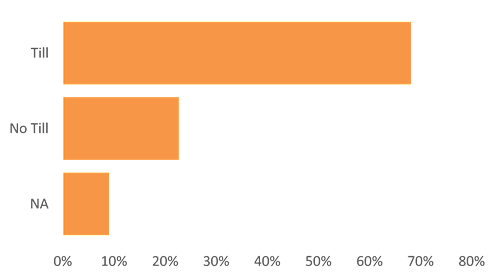
Tillage systems were described using estimates of crop residue cover and soil disturbance. However, since the type of tillage equipment and the degree of below surface soil disturbance could not be determined, tillage system reclassified to either a designation of no-tillage or tillage. Agricultural fields that use tillage account for 68% of the total observations - see Figure 3.
Figure 3. Tillage distribution for transect observations from 1994 - 2022.
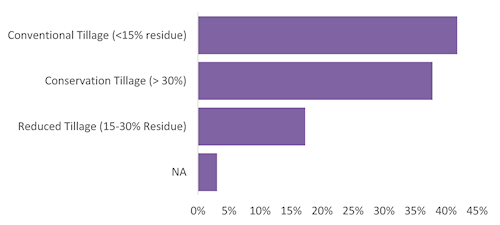
Crop Residue Cover was observed at five levels: level 1 = 0 to 15% crop residue cover 2 = 16 to 30% crop residue cover, 3 = 31 to 50% crop residue cover, 4 = 51 to 75% crop residue cover, and 5 = 76 to 100% residue cover. Conventional Tillage (defined as < 15% residue) is the most frequent observation when we look at absolute totals (42%), followed by Conservation Tillage (defined as > 30% residue) at 38% - see Figure 4. However, when looking at trends, there has been a decline of Conventional Tillage and an increase in Conservation Tillage - see Figure 8 (in Trends & Discussion section).
Figure 4. Crop Residue Cover distribution transect observations from 1996 - 2022.
General trends observed from the transect data primarily between 1994 - 2022.
Number of Fields: over the years there was a decline in the number of fields sampled each year and a total of 127 fields lost throughout the duration of the survey - see Figure 4. This decrease in total observations per year does not appear to be entirely explained by field no longer being agricultural production. The absence of an observation also may indicate missing data or the field being temporarily removed from agricultural production.
Figure 4. Number of fields sampled each year (click image to enlarge).
Crops: corn and small grains together account for 75% of the crops grown in Dane County. The number of observations of these two crops vary slightly from year to year, but there has been a small decrease of corn and small grains that seem to be taken by soybeans - see Figure 5.
Figure 5. Proportional distribution of crop by year for all fields as a % of observations (top) and as a numerical count of observations (bottom). Click each image to enlarge.
Tillage: an agricultural operation that mechanically manipulates the soil for the enhancement of crop production is called tillage. Tillage is used to prepare the seedbed, remove or destroy weeds, or to control insects or other pests. There are many types of tillage (ex. disc or bedding) so we simplified our data by using only two categories: Till or No Till. Over the years, we observed a slow but steady decline in Till versus an equally slow and steady increase in No Till through the years - see Figure 6.
Figure 6. Total number of observations of Till vs No Till (click image to enlarge).
Crop cover residue was categorized Conventional Tillage (< 15% of residue), Reduced Tillage (15 - 30%), and Conservation Tillage (> 30%). Conventional Tillage, such as moldboard plowing, leaves the soil surface bare and loosens soil particles, making them susceptible to the erosive forces of wind and water. Conservation Tillage reduces erosion by protecting the soil surface and allowing water to infiltrate instead of running off. For crops where tillage is used, there has been a downward trend of Conventional Tillage in favor of an upward trend in Conservation Tillage from 1994 - 2022 (see Figure 7).
Figure 7. Total number of transect observations of residue by year (click image to enlarge).
The transect survey is a helpful tool for gaining information on the practices and trends occurring in Dane County. Dane County continues to implement the transect survey annually and trends are updated when time allows.
More information can be found in the master’s thesis (PDF) conducted by Kyle Kettner and Dr. Francisco Arriaga with the University of Wisconsin – Madison.
The Tillage Survey Dashboard provides visual summary of transect data and includes: