The Groundwater Testing Project in Western Dane County offered free nitrate sampling to residents with private wells in the the Towns of Mazomanie, Black Earth, Vermont, Blue Mounds, Perry, Primrose, Springdale, Cross Plains, Berry, and Roxbury between 2024 and 2025. Situated mostly in Wisconsin’s Driftless Area (unglaciated region), wells in this location are vulnerable to groundwater contamination due to the unique geology of the area. This project sought to collect and map groundwater data to identify areas for implementing conservation practices that can reduce nitrate leaching and provide education about groundwater quality to Dane County residents.
Groundwater in the Driftless Area is more susceptible to contamination because this area contains no overlying glacial sediments, has thin soils, and occurrences of fractured carbonate rock at the surface are common. A few different factors contribute to individual well water quality including the geology and types of rocks and minerals that groundwater moves through, land use, plumbing, well construction specifications, and well maintenance.
Nitrate is the most common groundwater contaminant in Wisconsin. Nitrate (NO3-) is a naturally occurring molecule found in plants and animals. Naturally occurring levels of nitrate are typically below 2 mg/L, and concentrations above that show that land use is impacting groundwater quality. Contamination sources include agricultural and lawn fertilizers, animal wastes that are stored or spread, septic system drain fields, and other bio-solids like municipal waste.
High levels of nitrate in drinking water is also a health concern. The Maximum Contaminant Level (MCL) for nitrate is 10 mg/L. Although studies are still emerging, there is evidence that suggests consuming drinking water above the MCL is linked to blue baby syndrome, increased risk of certain birth defects, thyroid disease, and kidney cancer. If drinking water is above 10 mg/L, it is recommended that infants and pregnant women or women who may become pregnant avoid consuming this water immediately, and everyone should avoid long-term consumption. It is recommended to test your private well for both nitrate and bacteria contamination annually to ensure a safe water supply.
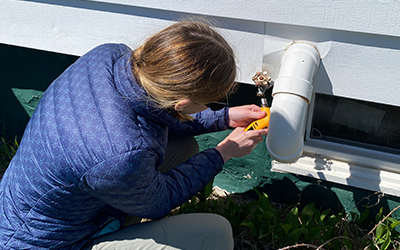
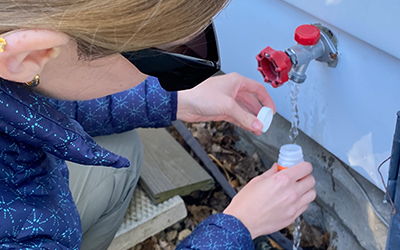
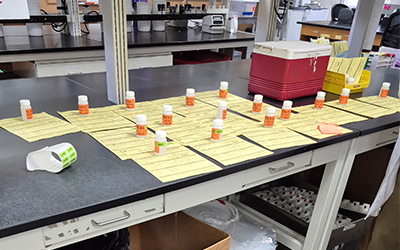
Residents were invited to participate via direct mailings. A total of 1,292 samples were collected on a first-come first-served volunteer basis. Sample analysis was completed at the Wisconsin State Lab of Hygiene, and participants received a copy of their individual sample results. These results were compiled for data analysis, and ArcGIS Pro software enabled the spatial visualization of nitrate concentrations across the region.
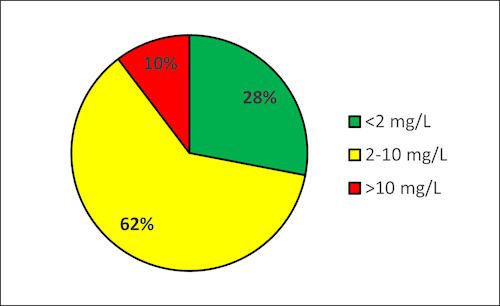
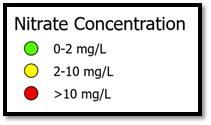
The project yielded significant findings regarding nitrate concentration in the sampled wells. 90% of sampled wells showed a presence of nitrate, with 10% of wells exceeding 10 mg/L. The overall average was 4.85 mg/L and the median was 4.06 mg/L. Additionally, 28% of wells tested between 0-2 mg/L, 62% of wells tested between 2-10 mg/L, and 10% tested above 10 mg/L – see Figure 1. In addition, it is important to note that 1.2% of samples tested above 20 mg/L, with 26.7 mg/L being the highest result. These numbers vary widely by each individual town, and results by town can be viewed in the “Results by Town” tab.
Figure 1. Overall nitrate concentration results by category.
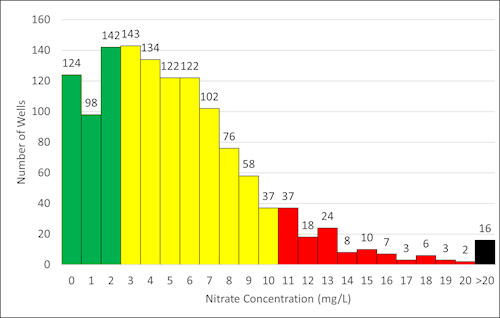
Nitrate concentrations are displayed in a histogram below – see Figure 2. It is important to note that results are grouped into the next largest whole number. For example, wells listed in the 2 mg/L column contain sample results from 1.01 to 2.0 mg/L.
Figure 2. Nitrate Concentrations in Surveyed Private Wells in Western Dane County.
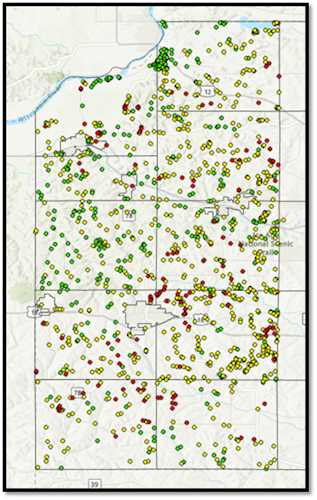
Below are the same results displayed spatially – Figure 3. Participation was fairly consistent across each town at a 25-34% response rate.
Figure 3. Nitrate Concentrations displayed spatially.
Interestingly, results of high and low nitrate concentrations showed some clustering – see Figure 4. A hotspot analysis using the Getis-Ord Gi* statistic was used to determine where these clusters are. To be statistically significant, a point will have a high value and be surrounded by other points with high values as compared to the whole dataset. It is important to note that a hotspot doesn’t necessarily mean that the contamination is coming from that same location, and more in-depth groundwater flow analysis is needed to determine where these wells are receiving groundwater from.
Figure 4. Hotspot Analysis of Nitrate Concentrations in Private Wells
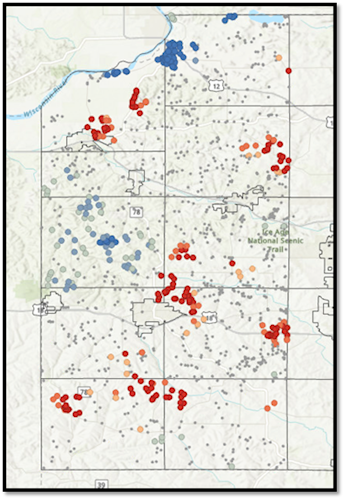
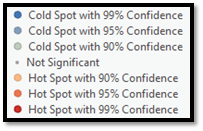
Figure 1. Town of Mazomanie results.
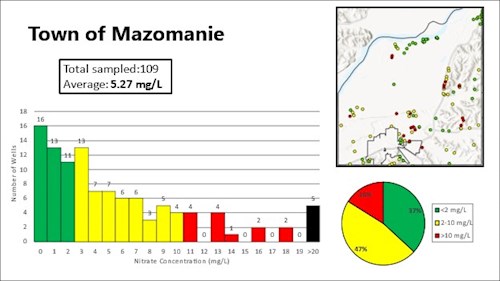
Figure 2. Town of Black Earth results.
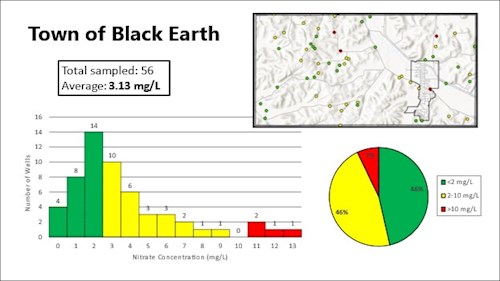
Figure 3. Town of Vermont results.
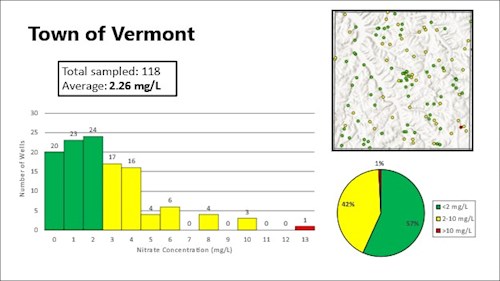
Figure 4. Town of Cross Plains results.
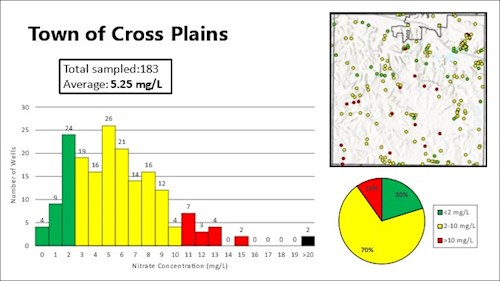
Figure 5. Town of Berry results.
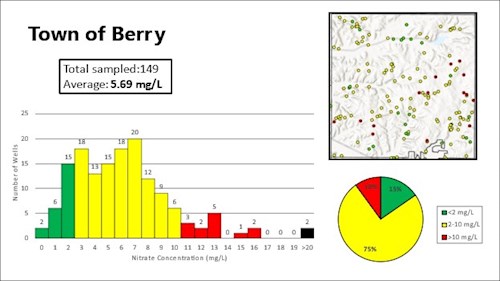
Figure 6. Town of Roxbury results.
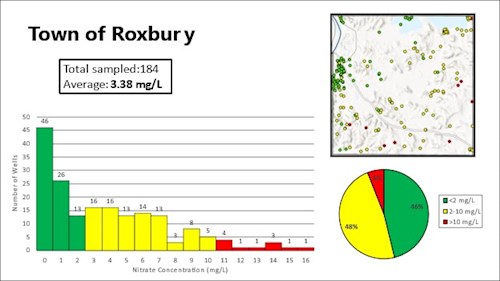
Figure 7. Town of Blue Mounds results.
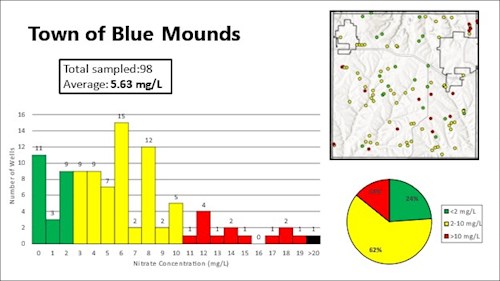
Figure 8. Town of Perry results.
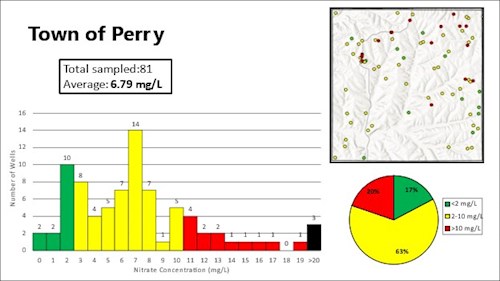
Figure 9. Town of Springdale results.
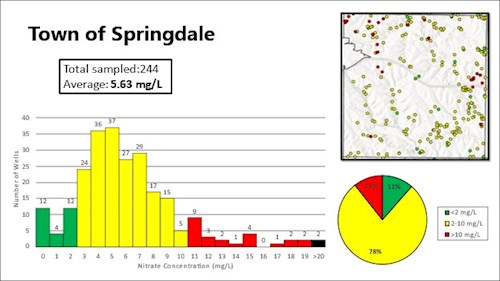
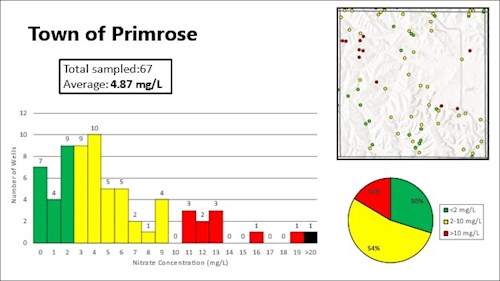
Figure 10. Town of Primrose results.
Areas identified using the hotspot analysis tool will be further analyzed to determine the groundwater flow paths. More analysis can be done to determine if there is a correlation between specific aquifers and groundwater quality by researching well construction reports. Furthermore, increased efforts will be made to implement conservation practices that can reduce agricultural derived nitrate leaching in these identified areas. These practices include nutrient management planning, implementing cover-crops, and no-till.